


Demystifying the concept of Base in MMM and Why 93% base is baseless.
If you are a marketer adopting MMM, it is imperative you know about Base aka Brand Equity.


“Never let facts get in the way of a good story” - Mark Twain.
The above quote is good for general life purposes especially if you want to provide succor to someone despondent.
However marketers often take the above to extreme.
Ask how?
Marketers suspend their rational and logical thinking, the moment they see a beautiful chart.

Recently I came across a post (with a beautiful chart of course) on LinkedIn from a MMM vendor in which there was a claim that 93% of sales came from the Base (aka Brand Equity). Further the vendor also claimed that upon cutting of media spends, the sales dropped by 5-7%.
The post received a lot of positive attention from marketers while none of them raising any suspicion at the unrealistic numbers.
Now you can see why I started the post with Mark Twain’s quote and the meme above :) .
Before we delve further into debunking the claim of 93% brand equity, I want to first demystify the concept of Base or Brand Equity in MMM.
So what is the Base?
It all starts with something known as Marketing Mix Modeling (MMM). I term it as ‘Scientific way of assigning blame or credit to your marketing channels’.
MMM is a Scientific way of assigning blame or credit to your marketing channels.
But a more proper definition courtesy my co-founder Ridhima Kumar (who also happens to be my MMM guru) defined MMM like this in her famous article MMM 101:
“Market Mix Modeling (MMM) is a technique which helps in quantifying the impact of several marketing inputs on sales or Market Share. The purpose of using MMM is to understand how much each marketing input contributes to sales, and how much to spend on each marketing input.”
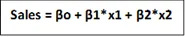
Marketing Mix Modeling (MMM) uses the principle of Multi-Linear Regression. The dependent variable could be Sales or Market Share. The independent variables usually used are Distribution, Price, TV spends, outdoor campaigns spends, newspaper and magazine spends, below the line promotional spends, Digital Spends and Consumer promotions information etc.
An equation is formed between the dependent variables and predictors. This equation could be linear or non-linear depending on the relationship between the dependent variable and various marketing inputs. There are certain variables like TV advertisement which have a non-linear relationship with sales. This means that increase in TV GRP is not directly proportional to the increase in sales.
The betas generated from Regression analysis, help in quantifying the impact of each of the inputs. Basically, the beta depicts that one unit increase in the input value would increase the sales/profit by Beta units keeping the other marketing inputs constant.
Sorry for the short statistics class but the above needed to be explained as it will act as the foundation to understand the points I would be making shortly.
The Contribution Chart
Remember that I mentioned MMM to be a scientific way of assigning blame or credit to marketing channels?
One of the ways the MMM results are communicated to clients is through contribution charts.
Predominantly people use bar charts but some use waterfall charts (never been a fan of it. Looks like a bunch of waves and the numbers are hard to discern).
I will not cover how the contribution chart are made. For that pls read Ridhima’s MMM series.
This is what a contribution chart looks like.
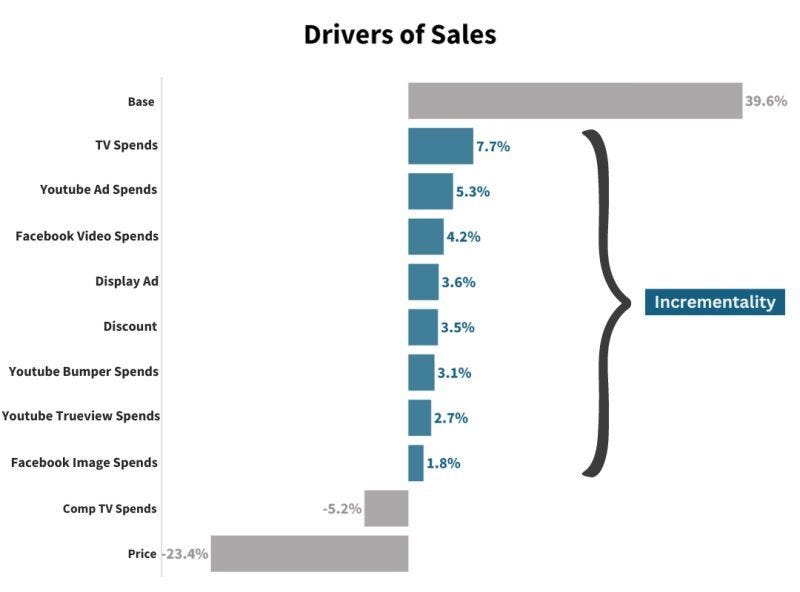
As you can see the beauty of MMM is that it is a big incrementality test in itself.
Incrementality is defined as the additional impact of a marketing on the KPI (Sales, TOMA, CAC etc..) over and above what would have been generated organically.
Now the word ‘organically’ is very important in this post’s context.
In MMM, the sales from Base aka brand equity is termed as organic sales.
But how does any brand get this organic sales or 'sales in auto-pilot mode’?
Answer - Consistent marketing spends over many years and longevity.
How does any brand get this organic sales or 'sales in auto-pilot mode’?
Answer - Consistent marketing spends over many years and longevity.
Now we have all the basic understandings of what is Base (Brand Equity). So lets now debunk the 93% sales from base claims.
By now we covered a lot of topics, so feel free to take a small break, grab your favorite beverage. But most importantly come back to this post. The interesting part is ahead.
Debunking the 93% sales from base

Firstly I want to clarify that the spends on other channels depicted above is my illustration or assumption (just to drive home the point). But the number on Base is exactly as depicted by the vendor in the LinkedIn post.
So, can a brand really have 93% base?
Having seen and analyzed Marketing Mix Models (MMM) for over a decade, I find a 93% baseline (brand equity) to be quite unrealistic. Such a high percentage suggests one of the following issues:
The model is overfitting.
The model lacks the right variables to properly distribute attribution, leading to an "overt attribution effect" on the base.
The brand in question is nearly 100 years old, but even then, a 93% baseline is unheard of !!
Cutting media investments led to sales drop by 5-7% within a two-week cycle
The vendor had made this argument that upon cutting media spends there was a sales drop of 5-7% within two week cycle.
But this doesn’t hold any water.
Contrary to their claim, this is actually a telltale sign that the model is over-attributing to the base while under-attributing to media.
The fundamental idea of brand equity is that it represents the sales happening organically because the brand holds a strong position in consumers’ minds (mental availability).
Brands with strong equity, such as Gillette and Old Spice, remain in consumers' consideration sets even if they stop advertising for a period of time.
In fact, I can't recall the last time I saw an ad for either, yet I continue to purchase them once a month.
A brand with 93% brand equity should not experience a 5-7% sales drop within weeks of pausing media spend.
Brand equity sales are inherently sticky, meaning short-term media fluctuations should not have such a drastic impact. If a brand's sales are highly sensitive to short-term media cuts, it contradicts the claim of high brand equity-both statistically and from a marketing standpoint.
Brand equity sales are inherently sticky, meaning short-term media fluctuations should not have such a drastic impact. If a brand's sales are highly sensitive to short-term media cuts, it contradicts the claim of high brand equity-both statistically and from a marketing standpoint.
A brand with high brand equity should be resilient to short-term fluctuations in media spending. If short-term sales are this dependent on media, then the brand does not have high brand equity.
A brand cannot claim to have both:
Exceptionally high brand equity (93%), which implies sales stability.
High sensitivity to media spend changes, which implies dependency on advertising.
These two conditions are mutually exclusive. If your sales immediately drop when you pause media, it suggests the brand equity is not as high as claimed.
Additionally, a brand with 93% brand equity should not have significant volatility in its media spend-to-sales relationship. If the model is not incorporating the right variables to explain long-term brand effects, it is committing omitted variable bias - a common issue in poorly specified MMM models.
So now I hope you can see why 93% base claim is unrealistic.
The Defense of - “Oh the base is 93% because it contains price, promotions, distribution , share of shelf ”
Some marketers supported the vendor’s 93% brand equity claim by making the argument that base could be 93% because it may have confounders like price, promotions, distribution, share of shelf etc.
I am again sorry to take you on a short statistical lesson but don’t worry I wont bring up any greek letters or formulas.
Remember that I told you MMM is a form of linear regression?
In linear regression, there is a concept of intercept.

The intercept is defined as the the expected value of Y(dependent variable) when all your X (independent variable are set to zero). For a thorough understanding of intercept, I would highly recommend this article.
In the MMM parlance, your Y is sales and the X’s are your marketing channels.
Basically the intercept of linear regression is the Base in MMM.
In an MMM setting, the base is actually the number we get by setting all the marketing channels to zero.
So in marketing language you are asking, what sales can we expect to get if we turn off all the marketing channels to zero.
But here is a big catch
Not all your variables in marketing can be set to zero. Think for a minute about the following:
Can you price your product to zero?
Can you eliminate all the shops that house your brand from the face of the earth?
Can you pull out all your products from every store possible or say any e-commerce platform?
Can you wish away winter or summer?
Can you wish away Christmas or any such festivities?
If your answer is NO, congratulations you have clearly understood why the base can’t have these confounding factors.
Even if for assumptions sake we do agree that one could include distribution and price, still 93% brand equity is unheard of !!
The Yin and Yang of Media and Brand Equity
What is the eventual goal of marketing?
The eventual goal of marketing is to do less or no marketing.
The eventual goal of marketing is to do less or no marketing
As a subset, the following also extends
▪ The goal of more advertising eventually is to do less advertising.
▪ The goal of more branded keyword paid search is to do less branded keyword paid search in future.
▪ The goal of investing more GRPs eventually is to do spend less GRPs.
I know these are somewhat paradoxical statements. But just like a doctor works to have less patients, a marketers ideal goal should be to help brands do less marketing.
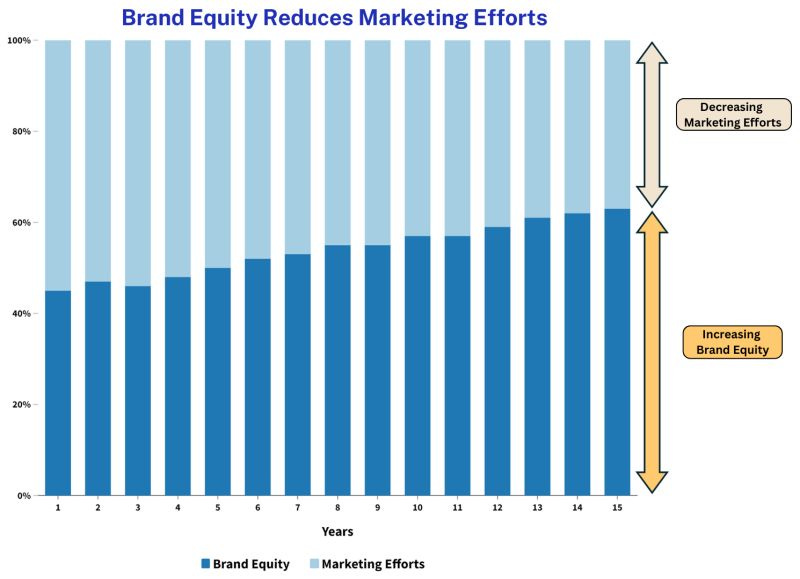
Base (Brand Equity) is a barometer of what you have done well historically. Unlike other marketing inputs, brand equity don't change drastically.
The movement either negative or positive is always in small increments.
High brand equity creates a happy problem for marketing measurement. Getting incremental sales from other marketing investments becomes harder and harder once your brand equity reaches a high point.
This in turn makes it harder for MMM to discern the true incremental effect.
The conclusion
The intention of this post is not to do one-upmanship over the vendor . Rather this post is an genuine attempt to demystify the concept of base among marketers. And most importantly it is a plea to marketers to pay attention to the numbers and not let beautiful charts cloud their rational / logical thinking.
So with that said, here is the summary.
Strong brands with high equity do not experience drastic sales drops within weeks of media cuts.
The observed volatility suggests that the MMM model is either over-attributing to the base or under-attributing to media, leading to misleading conclusions.
Achieving strong brand equity (60-75%) is a decades-long process, typically taking 50+ years in CPG/FMCG and other established industries.
Claiming 93% brand equity, coupled with high sales volatility from media cuts, is both a statistical and marketing improbability.
Thank you for your patient reading.
Thanks for reading.
For consulting and help with MMM implementation, Click here
 | A guest post by
|